
July 10, 2022
Using the Propogation data on QRZ.com
Greetings to all,
This weeks Tek Net session was suggested by a member wanting to know more about the Propagation display window that resides on the Home page of the QRZ.com site.

First, I will admit that I have not used this very often and invite those folks on tonights Tek Net that has experience with this to please speak up, as all the information available is rather intense and would cover more then the 1 hour we try to hold the Tek Net to.
I feel that some information and explanations are in order.
If some of my data can be better defined please jump in and help out with this.
What may not be evident is that the above image is actually 4 separate information screens.
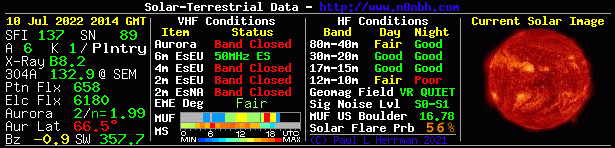
These screens of information is a collection of work from several sources that are located around the world.
Some of the data is updated once a day, others every 3 hours while others are updated in shorter time frames up to the point of approaching real-time. I’ll cover these sources later on down the page.
The VHF section and the HF section is an excellent way to see what conditions the bands are currently in.
For a more complete glossary of terms, go to < hamqsl.com/solar2.html#glossary >
Definitions as displayed in the first section.
SFI – Solar Flux Index
NOAA reported value from 0 to 400. Provides a daily average level for geomagnetic activity. Uses the average of eight 3 hour K-Index values (magnetic value measured in nanotesla or nT) to provide the level of instability in the earth’s geomagnetic field. When used with K-Index: Both high indicates geomagnetic field is unstable, and HF signals are prone to sudden fades, and some paths may close while others open up abruptly and with little warning. High K index/Low A indicates a sudden, abrupt disturbance in the geomagnetic field, which can cause an intense but brief disruption in HF propagation, but can cause an auroral event. Updated once daily.
SN – Sunspot Number
Sunspot Number provided by NOAA is a reported value from 0 to 250. It is computed using a formula [R=k (10g+s)] by Rudolph Wolf in 1848, where R is the sunspot number; g is the number of sunspot groups on the solar disk; s is the total number of individual spots in all the groups; and k is a variable scaling factor (usually less than 1) that accounts for observing conditions and the type of observing device. NOAA SN does loosely correlate to SFI. Updated once daily.
A – Planetary A Index
NOAA reported value from 0 to 400. Provides a daily average level for geomagnetic activity. Uses the average of eight 3 hour K-Index values (magnetic value measured in nanotesla or nT) to provide the level of instability in the earth’s geomagnetic field. When used with K-Index: Both high indicates geomagnetic field is unstable, and HF signals are prone to sudden fades, and some paths may close while others open up abruptly and with little warning. High K index/Low A indicates a sudden, abrupt disturbance in the geomagnetic field, which can cause an intense but brief disruption in HF propagation, but can cause an auroral event. Updated once daily.
K – Planetary K Index
NOAA reported value from 0 to 9. Measures disturbances in the horizontal component of earth’s magnetic field. Value in nT is measured using a magnetometer during a three-hour interval, and then converted to a factor. Use with A-Index – sees above to determine HF conditions. Updated eight times daily.
X-Ray – Hard X-rays
NOAA reported value from A0.0 to X9.9. Intensity of hard x-rays hitting the earth’s ionosphere. Impacts primarily the D-layer (HF absorption). The letter indicates the order of magnitude of the X-rays (A, B, C, M and X), where A is the lowest. The number further defines the level of radiation. Updated eight times daily.
304A – 304 Angstroms
NOAA reported value from 0 to unknown. Relative strength of total solar radiation at a wavelength of 304 angstroms (or 30.4 nm), emitted primarily by ionized helium in the sun’s photosphere. Two measurements are available for this parameter, one measured by the Solar Dynamics Observatory, using the EVE instrument, and the other, using data from the SOHO satellite, using its SEM instrument. Responsible for about half of all the ionization of the F layer in the ionosphere. 304A does correlate to SFI (see graph below). Updated hourly.
Ptn Flx – Proton Flux level
NOAA reported value from 0 to unknown. Density of charged protons in the solar wind. The higher the numbers, the more the impact the ionosphere. Primarily impacts the E-Layer of the ionosphere. Updated hourly
Elc Flx – Electron Flux level
NOAA reported value from 0 to unknown. Density of charged electrons in the solar wind. The higher the numbers(>1000), the more impact the on ionosphere. Primarily impacts teh E-Layer of the ionosphere. This is updated hourly.
Aurora or Aur – Aurora
Data is now calculated from the hemispheric power value (0-150 GW) to give the reported scaled factor value from 0 to 10++. Indicates how strong the the F-Layer ionization is in the polar regions. Higher values cause auroral events ( including the northern /southern lights) to moveto lower latitudes. This is updated every 15 minutes.
Aur Lat – Aurora Latitude
Calculated value from 67.5 to <45.0. Calculation from NOAA utilizes the current Aurora measurement. Used to estimate the lowest latitude impacted by the auroral event. This is updated every 15 minutes.
EME Deg – Earth-Moon-Earth Degragation
Make more miles reported value (used with permission). Reports Band Closed, High MUF when conditions support Es, and 144Mhz ES when the band is reported open. This is updated every 30 minutes.
**************************************************************************************************************************************
As I mentioned earlier, the amount of information on understanding and using the this information is a lot more than can be covered in a single Tek Net.
That being said the place that I found to be the most helpful and clear cut explanations were done by N0NBH Paul Herrman in Arizona. He has a listing of all teh Sun’s images and the temperature differences as well an excellent understanding of these images.
I hope that this helps those that had questions about using the propagation section that is on teh QRZ.com Home page, this is also available to put on your own web page and can be specific to your particular interests regarding HF and VHF propagation.
Global Real-Time Ionospheric foF2 Map
When using this from the Australian Space Weather Agency, there is a pull-down menu for you select what map you want displayed at that moment.